

There has never been a calm year to invest in
We live in a world that commands our attention. Conflict in the Middle East. Oil prices are climbing. Inflation returning. Market volatility. The headlines are impossible to ignore, and the questions they raise are the ones every investor is asking: Will markets recover? Will my investments be all right? Am I making the right decisions?
In moments like this the instinct to act is powerful. It is tempting to adjust the strategy, to second-guess the approach, to abandon the plan we built when times were clearer. But this is precisely the moment to follow our own advice — to lean on the roadmap we have in place, to trust the planning already done, and to have faith in the process.
That is easy to say and hard to do. So rather than simply assert it, this article sets out the evidence: what investors were afraid of in each of the past nine years, what those years actually delivered, and what it would have cost to step aside and wait for calm.
The History of Uncertainty
There is a trick our memory plays on us. Looking backwards, the path from A to B seems almost orderly — a few bumps, but a clear line. We know how it turned out, so it feels as though it was always going to turn out that way.
Looking forwards, it feels nothing like that. The path ahead is a tangle. We cannot see through it, and every knot in it feels like it might be the one that stops us.
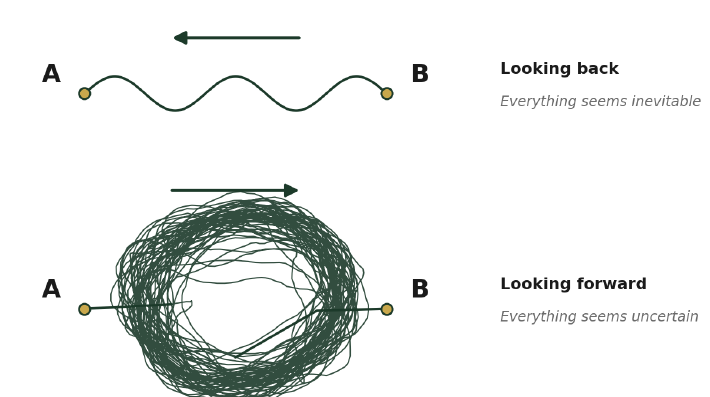
Both pictures show the same journey. The only difference is where you are standing. The past feels predictable only because we have already lived through it — and the present feels uncertain only because we have not lived through it yet. The uncertainty you feel today is not evidence that something has gone wrong. It is simply what the present always feels like.
What We Were Worried About — and What Actually Happened
The chart below sets one fund’s annual return against the crisis that dominated that year. Every one of these years gave investors a compelling reason to sell, or to wait, or to move to cash. Read the top row on its own and it is a decade of disaster. Read the bars beneath it and a rather different story emerges.
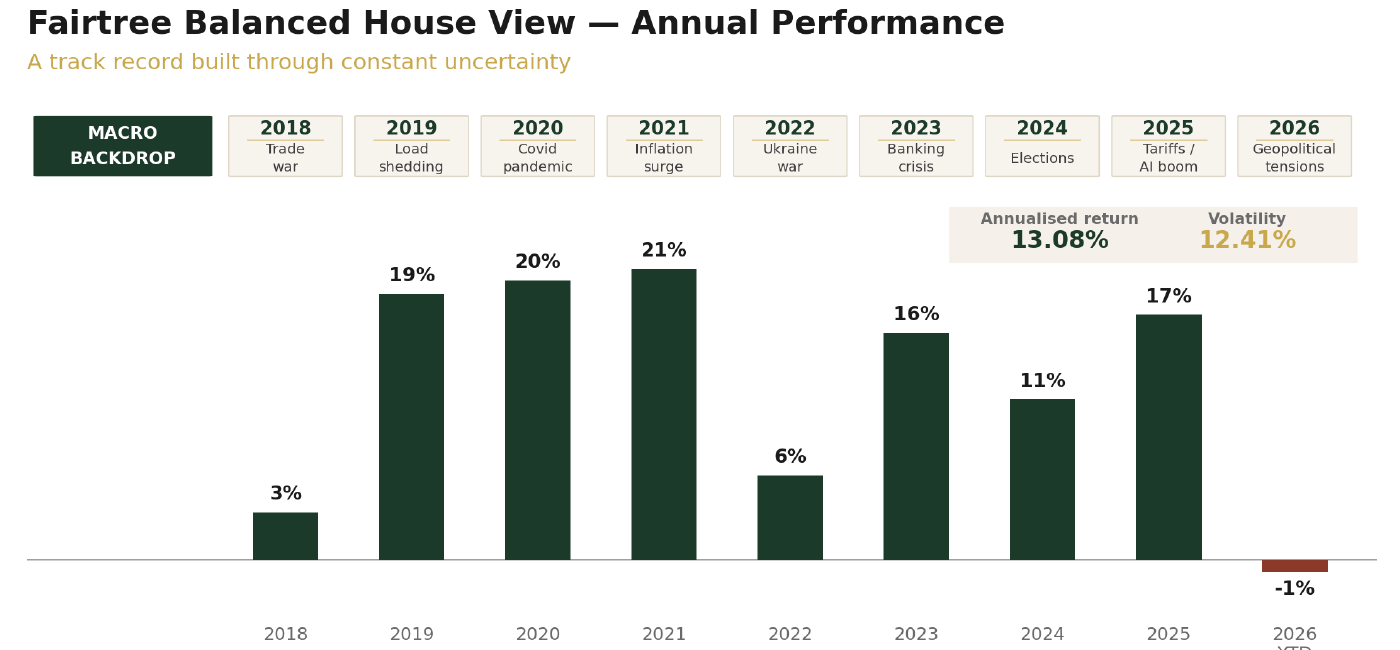
Eight of the nine years were positive, several of them strongly so — and every one of them was delivered against the backdrop above, not in its absence. But nominal returns are only half the story.
Annual returns of the Fairtree Balanced House View, net of fees, as published in the fund’s minimum disclosure document (31 May 2026). The 2026 figure is year-to-date and not a full year. Annualised return and volatility are measured since common inception (September 2017). Past performance is not a guide to future returns.
The Years in Context
A single word on a chart carries little meaning. Below is what actually happened in each year, what the fund returned, and what inflation was over the same period.
| Year | The headline | Fund | Inflation | What actually happened |
|---|---|---|---|---|
| 2018 | Trade war | +3.4% | 4.7% | The United States imposed sweeping tariffs on Chinese goods and China retaliated. Investors feared a breakdown in global trade would slow the world economy. Emerging markets, South Africa among them, were hit hardest as capital moved to safety. Below inflation: a real loss. |
| 2019 | Load shedding | +18.8% | 4.1% | Eskom’s generating capacity deteriorated sharply and South Africa endured its most severe rolling blackouts to that point. The rand weakened, growth forecasts were cut, and many investors questioned whether South African assets were investable at all. |
| 2020 | Covid pandemic | +19.8% | 3.3% | The pandemic triggered the fastest market crash in modern history. Global equities fell roughly a third in weeks and economies were locked down with no visible end. This fund fell 12.3% in March alone. It felt like the most dangerous moment of most investors’ lives. |
| 2021 | Inflation surge | +20.6% | 4.5% | As economies reopened, supply chains buckled and inflation climbed to levels not seen in decades. Investors worried central banks had lost control and that painful interest-rate increases were coming. |
| 2022 | Ukraine war | +6.0% | 6.9% | Russia invaded Ukraine. Energy and food prices spiked and central banks launched the most aggressive rate-hiking cycle in forty years. Equities and bonds fell together — the diversification that normally cushions a portfolio did not work that year. Below inflation: a real loss. |
| 2023 | Banking crisis | +16.1% | 6.0% | Silicon Valley Bank collapsed, Credit Suisse had to be rescued, and for several weeks a wider banking failure looked possible. Comparisons with 2008 were everywhere. The crisis was contained, but the fear while it unfolded was entirely genuine. |
| 2024 | Elections | +11.3% | 4.4% | A record share of the world’s population went to the polls. In South Africa the governing party lost its majority for the first time since 1994, producing a coalition government that markets had no template for. Political uncertainty dominated the year at home and abroad. |
| 2025 | Tariffs and the AI boom | +17.3% | 3.2% | The United States imposed its steepest tariffs since the Second World War, with duties on Chinese goods reaching 145% and China retaliating at 125%. Markets sold off sharply on the announcement. Yet global trade did not collapse — it grew faster than the world economy, propelled by an extraordinary boom in AI investment, and equities finished the year strongly. |
| 2026 YTD | Geopolitical tensions | −0.9% | 4.5% | Conflict in the Middle East and the closure of the Strait of Hormuz drove Brent crude sharply higher. Global equities fell 9% between late February and the end of March. The Reserve Bank raised rates and inflation began climbing again. This is the year we are living through now — and it feels, as these years always do, like the uncertain one. |
Fund returns: Fairtree Balanced House View, net of fees, from the fund’s minimum disclosure document (31 May 2026). Inflation: South African headline CPI, annual average (Statistics South Africa); the 2026 figure is the annual rate to May 2026. The 2026 fund figure is year-to-date and not a full year.
The Honest Qualification
Eight of those nine years were positive. But two of them did not keep pace with inflation. In 2018 the fund returned 3.35% while prices rose 4.7%. In 2022 it returned 5.96% against inflation of 6.9%. On paper both were gains. In purchasing power, both were small losses.
We show this because a document that tells you only the good half is not worth reading. Staying invested does not mean every year rewards you. It means that across the full stretch — including the years that disappointed — the investor who remained was substantially better off than the one who did not.
The Longer View
The pages above showed a single year-by-year view. Below are two funds followed over their full lives — a balanced strategy and an aggressive one. Each line traces what R100 invested at the start would have become. The dashed line shows what R100 would have needed to become simply to keep pace with South African inflation.
That second line matters more than it looks. Money left in cash does not stand still — it shrinks quietly, every year. The real question is never “did I make money?” but “did I make more than the rising cost of living?”
The balanced option
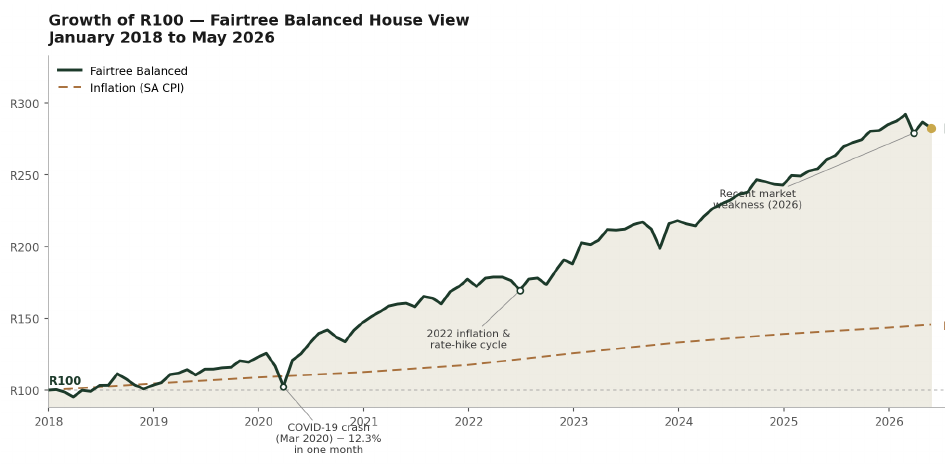
R100 grew to R282 against R146 for inflation — a real gain of 94%. Note the March 2020 collapse: a fall of 12.3% in a single month. That is the moment an investor would most have wanted to sell, and it is precisely the moment selling would have cost the most.
The aggressive option
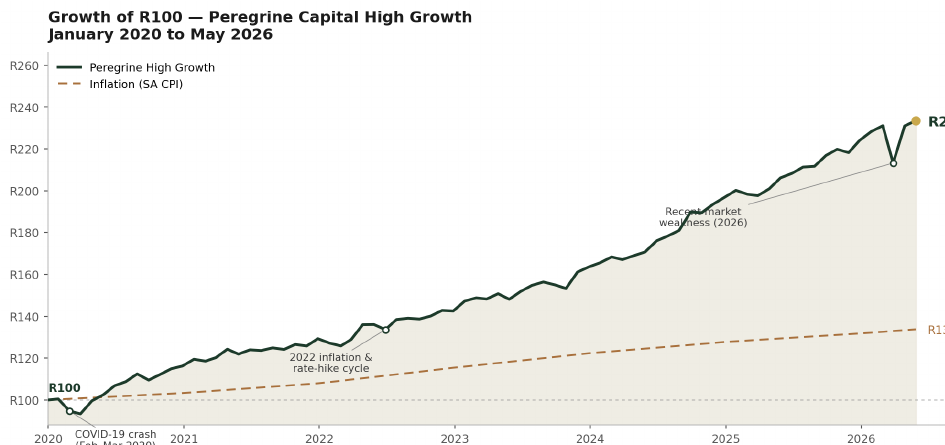
R100 grew to R233 against R134 for inflation — a real gain of 75%, achieved with active management of downside risk through every shock in the period.
Fund performance from each fund’s minimum disclosure document (31 May 2026), net of fees. Every figure shown is the fund’s actual published track record; no simulated or back-filled performance is used anywhere in this article. Inflation line: South African headline CPI (Statistics South Africa), applied at the monthly equivalent of each year’s average annual rate. Measurement periods differ by fund and are stated on each chart. Past performance is not a guide to future returns.
The Cost of Getting Out
Everything so far has shown what staying invested delivered. This shows the other side of the ledger: what leaving would have cost.
The reason lies in how markets actually recover. The strongest days do not arrive once things feel calm and confident again. They arrive in the middle of the turmoil, and they arrive without warning.
J.P. Morgan’s analysis of the past two decades found that seven of the market’s ten best days occurred within two weeks of its ten worst days. In March 2020, the second-worst day of the year was the 12th. The second-best day of the year was the 13th. They were consecutive.
The rebound and the crash are not merely close together. They are neighbours. An investor who sells to escape the bad days almost inevitably misses the best days too, because nobody can reliably step out for one and back in for the other.
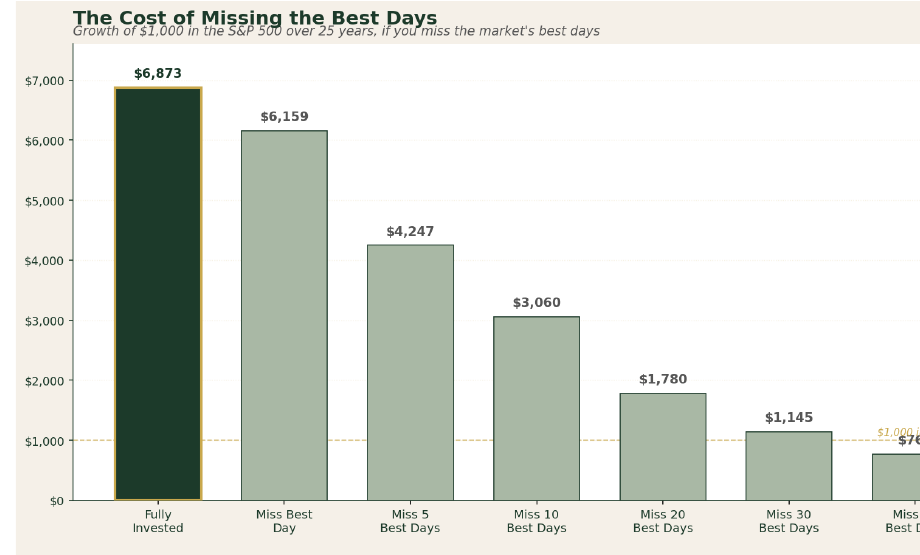
An investor who put $1,000 into the S&P 500 and simply stayed put for 25 years finished with $6,873. An investor who missed only the ten best days — ten days out of roughly six thousand — finished with $3,060, less than half. Miss the best forty days and the $1,000 becomes $769, barely more than where it started.
Missing the 40 best days over 25 years did not merely reduce the gain. It erased it entirely — and then took $231 of the original capital with it.
This is the hidden cost of getting out. It rarely announces itself, because the investor who sold never sees the recovery they missed — they only feel the relief of having escaped the fall.
Based on an initial $1,000 investment using S&P 500 returns before transaction costs, over the 25 years to 1 July 2026. Source: Clearnomics, Standard & Poor’s. Shown in US dollars and reflecting a United States index; it is included to illustrate a behavioural principle, not as a recommendation to invest in that market.
The Point
Not one of those years was calm. Not one arrived with a note explaining that it would work out. In each of them there was a credible, serious, well-argued reason to step out and wait — and in almost every one of them, the investor who did so would have been worse off for it.
This is not an argument that risk does not exist, or that markets always rise. They do not. Two of those years lost purchasing power, and the year we are in has so far been negative. The point is narrower, but it matters: the presence of uncertainty is not, in itself, a signal to act. Uncertainty is the permanent condition of investing, not a temporary disruption to it.
The plan you have in place was not built for calm markets. It was built for exactly these ones.
This material is provided for educational and illustrative purposes only and does not constitute advice. The two funds shown illustrate long-term investment behaviour; their inclusion is not a recommendation to invest in them. Past performance is not a guide to future returns. The value of investments may fall as well as rise and you may get back less than you invested. Please speak with your adviser to discuss your own circumstances and objectives.